Visualisations
Event analysis diagram
-
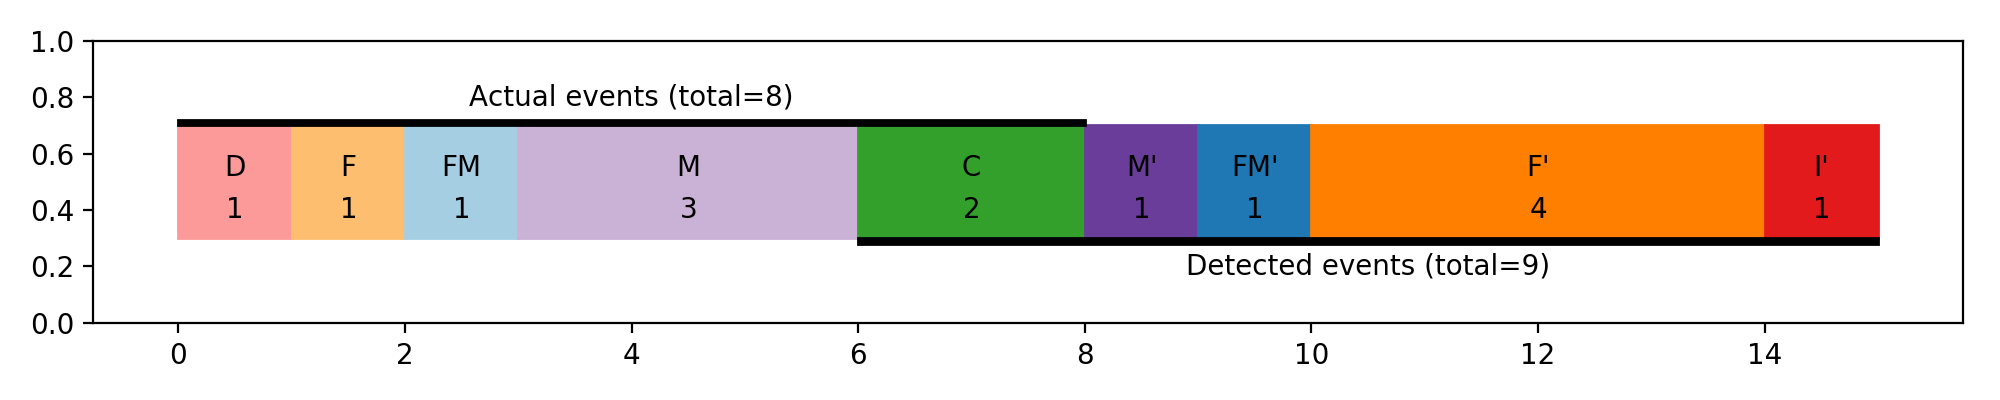
wardmetrics.visualisations.plot_event_analysis_diagram(event_results, **kwargs)[source]¶ Plot the event analysis diagram (EAD) for the given results
Visualisation of the distribution of specific error types either with the actual event count or showing the percentage of the total events. Elements of the plot can be adjusted (like color, fontsize etc.)
Parameters: event_results (dictionary) – Dictionary containing event counts for “total_gt”, “total_det”, “D”, “F”, “FM”, “M”, “C”, “M’”, “FM’”, “F’”, “I’” as returned by core_methods.event_metrics’ third value
Keyword Arguments: - fontsize (int) – Size of the text inside the bar plot (Reduce the value if some event types are too short)
- use_percentage (bool) – whether percentage values or to show actual event counts on the chart (default: False)
- show (bool) – whether to call plt.show (blocking) or plt.draw() for later displaying (default: True)
- color_deletion – any matplotlib color for deletion events
- color_fragmented – any matplotlib color for fragmented ground truth events
- color_fragmented_merged – any matplotlib color for merged and fragmented ground truth events
- color_merged – any matplotlib color for merged ground truth events
- color_correct – any matplotlib color for correct events
- color_merging – any matplotlib color for merging detection events
- color_merging_fragmenting – any matplotlib color for merging and fragmenting detection events
- color_fragmenting – any matplotlib color for merging detection events
- color_insertion – any matplotlib color for insertion events
Returns: matplotlib figure reference
Return type: matplotlib Figure